Last week, both the Dow and the S&P 500 hit new all-time highs. The Dow ended the day Friday just above the very large, very round number of 40,000. Such highs typically generate a lot of headlines and in turn client questions. Typical questions include: how can the market be so high – just look at fill in the blank; aren’t we in a bubble; shouldn’t we do something. And while I would never encourage complacency when it comes to monitoring the markets, corporate profits, or the economy, milestones like Dow 40,000 deserve some context.
To provide that context, I’d like to remind you of, or introduce you to, the Rule of 72. The Rule of 72 is an easy shortcut to determine how long it will take for a given amount of money to double in value based on the rate of return the money earns. The rule works like this: divide 72 by the rate of return and the answer is an approximation for the number of years for doubling. It’s easier to see how it works with an example – let’s use a nice round number – $100,000.
You put $100,000 into your savings account at a bank and earn 1% per year in interest. How long will it take to grow to $200,000? The Rule of 72 says: 72 divided by 1 (rate of return) equals 72 (years to double). It will take 72 years for your $100,000 to earn enough interest to double in value.
Here’s another example: you put $100,000 into an ETF that tracks the S&P 500. Over very long periods of time, the market returns 10% per year on average. Go to the Rule of 72: 72 divided by 10 (rate of return) equals 7.2 (years to double). Wow, your $100,000 grows to $200,000 in just a little over 7 years in a broad market ETF. That’s why we invest in the equity markets.
Now we all know that the stock market doesn’t grow 10% each and every year. Some years it goes up – sometimes by a lot; some years it goes down – sometimes by a lot. But over the past 100 years, the return of the S&P 500 is a bit over 10.5% per year.
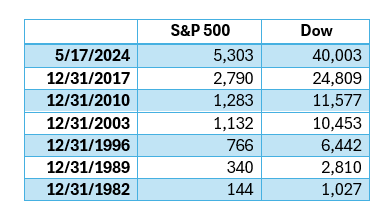
Let’s extend this idea and look at the S&P 500 and the Dow at 7-year intervals going back to 1982. If the market is following the Rule of 72, this gives us a chance to see 6 different doubles: 1982 to 1989; 1989 to 1996; and so on. Here is a table showing the closing values of the S&P 500 and the Dow on those given dates. Do we see doubling taking place?

If you take out a calculator and start doubling the 1982 values, you sometimes see more than a double, sometimes less. Doubling the 1982 values six times results in something lower than what is expected. You likely recognize that between 2003 and 2010, the change was much less than a double. And we all know what was going on in the middle of that time interval– the Financial Crisis/Great Recession of 2008/2009. While we don’t see quite as many doubles in the market between 1982 and now, does Dow 40,000 or S&P 5,300 seem crazy high? I argue that it does not.
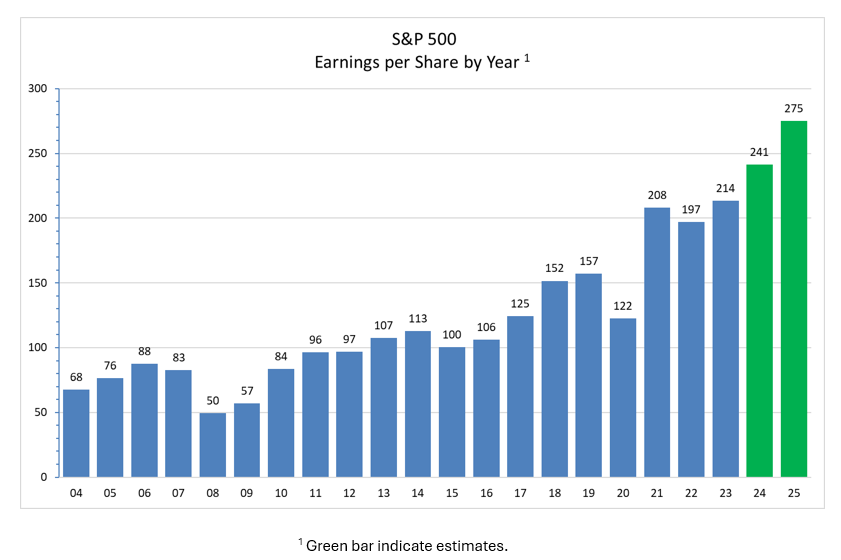
We know the market doesn’t just miraculously grow by 10% per year. That growth comes from growth in the economy and more importantly growth in corporate profits. Let’s look at the earnings of the S&P 500 companies from 2004 through 2023 (with estimates for 2024 and 2025). Do we see some doubles within corporate earnings?

As with the indexes, the 7-year double is a bit messy, but it’s there. Compare 2016 to 2023 – $106/share in 2016 versus $214 in 2023 – that’s pretty close.
If corporate profits continue to grow in the future as they have in the past, then we should not be surprised to see the Dow hit 80,000 or the S&P 500 hit 10,000 sometime within the next seven or eight years. That’s just the Rule of 72 at work.
While the Rule of 72 provides context for the current levels of the equity market, please know that I am always monitoring stress within the markets and the broader financial system. Such stress indicators help me determine whether underlying conditions might point to a change from the bull market we’ve experienced since October 2023 to something new.
Currently, I monitor more than a dozen different indicators – some exclusively focused on equity markets – others focused on the broader financial system. And what I see is below-average levels of stress across the board. That does not mean that some geo-political crisis won’t change that tomorrow – it certainly could. But Dow 40,000 is not an indicator of coming trouble for the markets – it’s simply a reminder of the Rule of 72.
If you have questions or would like to chat, please let me know.
Cheers!


