The Economics of the Supply/Demand Relationship
White Oak Financial Management focuses on the “price” of a security, because it is the ultimate determinant of supply and demand in the marketplace. When you cut through all the red tape on Wall Street, what moves a stock and Exchange Traded Fund (ETF) price is supply and demand. It is nothing more than ECONOMICS 101. We know that tomatoes in the winter don’t taste very good, don’t have a very long shelf life, and are expensive. The same forces that move prices in the supermarket move the stock market. When all is said and done, if there are more buyers than sellers willing to sell, the price of something will move higher. If there are more sellers than buyers willing to buy, the price will move lower. Analyzing the price action of a security can yield important information as to who is winning the battle for that security — supply or demand.
The Point & Figure methodology has been around for over 100 years. One of the first proponents of the methodology was Charles Dow, the first editor of the Wall Street Journal. Charles Dow was a fundamentalist at heart, yet he understood the importance of the supply and demand relationship in any stock. The Point & Figure methodology is just a logical, organized way of recording the forces of supply and demand.
A Road Map for Investing
If you were going to take a trip, driving from Washington, DC, to San Francisco, California, what would be the first thing you would do? Most likely, you would pull up the road map. You wouldn’t just blindly jump on any road and hope that it was the one that takes you to San Francisco. The probabilities of reaching your destination would be pretty slim. Unfortunately, most investors jump into an investment with no road map to guide them through their financial journey. The Point & Figure methodology provides us with an objective road map for the investment journey in any particular stock, ETF, or mutual fund.
Point & Figure Chart
The Point & Figure chart is simply a logical, sensible, organized way of recording supply and demand in any stock, ETF, or mutual fund. It answers the question of WHEN to buy and sell. Fundamental Analysis helps us to determine WHAT to buy. Charts are plotted daily with the high and low, and each column must have at least 3 X’s or 3 O’s, and the columns alternate. A rising series of X’s and O’s tells us that demand is getting stronger and supply is getting weaker — that is what we want to see in stocks, ETFs and mutual funds we own. In the Point & Figure methodology there are 11 different, identifiable patterns in the charts. They are all just variations on two basic patterns. Those two patterns are the Double Top and Double Bottom. As we evaluate charts we look for these two patterns and their variations.
Relative Strength vs. Market
One of the most important tools in the Point & Figure method is relative strength. This unique tool measures the likelihood that a stock will outperform the base index, the S&P 500 Equal Weighted Index. The calculation is a simple one: RS Reading = (Stock Price / the S&P 500 Equal Weighted Index) X 100 . This relative strength reading is then plotted on a separate Point & Figure chart. Every stock has not only a traditional price (trend) chart but also a relative strength chart where we look at the signal (long term RS performance) and the most recent column (short term RS performance). The best RS reading is when the chart is on a buy signal and in a column of X’s. These are the investments we look to buy.
Sector Rotation
Numerous academic studies have shown that successful sector rotation is one of the most important determinants of portfolio success. Sectors rotate in and out of season just like the produce in the super market. Sometimes those trends last for years, other times for months. The key to successful investing is to capture the explosive, positive outliers on the bell curve of sector returns and avoid the negative outliers. There are two main tools we use that guide our sector rotation strategy — Bullish Percents, an absolute measure, and Favored Status, a combination of trend and relative strength measurements. When determining sectors in which to focus, those with a Favored status and good field position on their bullish percent charts (around 50% or lower in X’s) will stack the odds in your favor. Favored sectors should make up the core of your holdings. Unfavored sectors can be those we underweight.
For up-to-date information about the current supply/demand environment, please navigate to Our Thinking and search for articles pertaining to Market Snapshot.
All investing involves risk including the possible loss of principal. No strategy assures success or protects against loss. All indices are unmanaged and may not be invested into directly.
Factor Analysis to Mitigate Risk
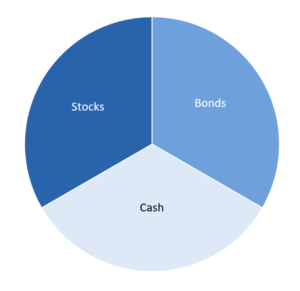
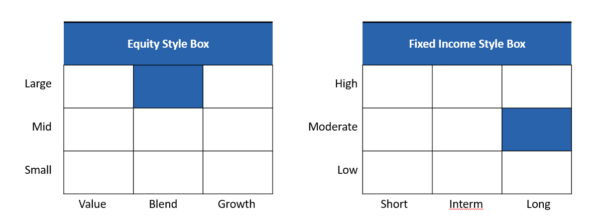
For years, investors looked for ways to mitigate risk in portfolios. Simple allocations among stocks, bonds, and cash gave way to style-box investing championed by firms like Morningstar.
More recently and as computing power increased, large institutional investors began to employ the statistical tool of factor analysis to uncover risk unseen through traditional means. Once uncovered, risk could be better managed.
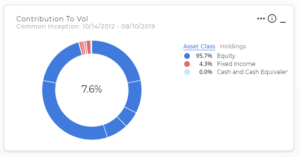
A cash-weighted chart displays a portfolios exposure to various asset classes. What is more telling and important to investors, however, is the volatility attributable to various asset classes. From factor analysis, 95% of this moderate portfolio’s volatility is produced by equities positions. And even further, factor analysis shows which specific equities are responsible for what portion of that volatility.

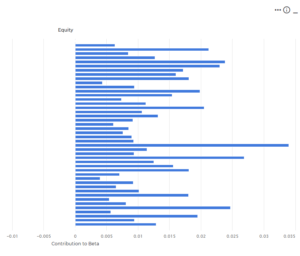
Such insight allows adjustments to be made in response. For example, if a particular situation suggests it is appropriate to dial down portfolio risk, then the positions responsible for higher levels of volatility become obvious candidates for change. Or if a new investment is being considered, understanding the risk parameters of current holdings facilitates sourcing the funds without unintentionally overweighting the portfolio toward a given factor.
Factor analysis also provides the opportunity to compare portfolios, one to another, over various time periods, with the intent of enhancing risk-adjusted returns. Stress-testing portfolios can also be accomplished across time periods extending back for 30+ years. Such insight can help align client expectations with potential outcomes.
White Oak Financial Management employs these tools to create, stress-test and manage portfolios with the goal of maximizing a client’s risk-adjusted returns.
All investing involves risk including the possible loss of principal. No strategy assures success or protects against loss. All indices are unmanaged and may not be invested into directly.