
As you are undoubtedly aware, technology is changing and enhancing all fields. And while much of the financial technology clients come in contact with is related to reviewing accounts online, paying bills, etc., we are beginning to see some real advancements in portfolio construction and risk mitigation tools.
Investment risk can be defined in various ways. It is a measure of the level of uncertainty of achieving the return an investor expects. But risk is often used interchangeably with the term volatility (the amount a security or portfolio goes up and down in value over time). While this is an over-simplification of risk, for many investors the amount of volatility they must endure is important. And for years, investment professionals worked to develop ways to respond.
Many years ago, we recognized that stocks, bonds and cash behaved differently over time. Asset allocation was born and portfolios were constructed to include components of each asset class with the goal of lowering risk while still achieving an acceptable return.

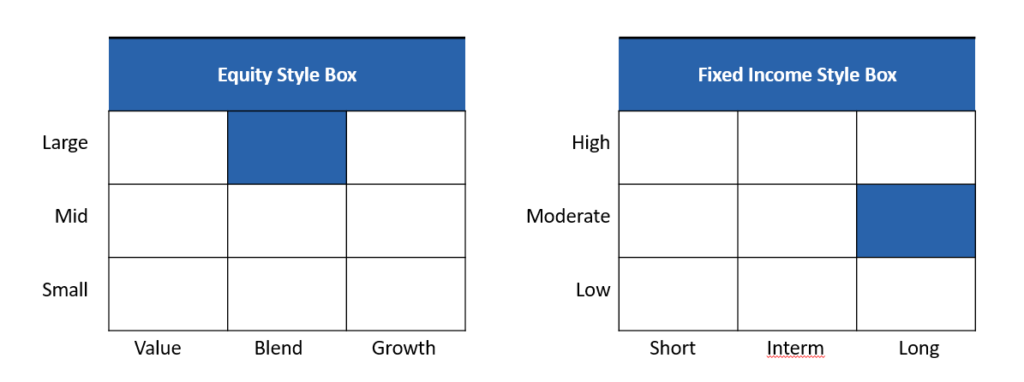
As time passed, we recognized that all stocks do not behave in the same way and the same for bonds. The stock of a large, well-established company like Proctor and Gamble, behaved very differently from the stock of a new, high-growth company like Facebook. The same was true for the behavior of a AAA-rated municipal bond compared with the behavior of a high-yield bond issued by a struggling company. Style-box investing was the result, with portfolios constructed to include components from all possible style-box squares.
More recently and as computing power increased, large institutional investors began to employ the statistical tool of factor analysis to uncover risk unseen through traditional means. Once uncovered, risk could be better understood and managed.
While research is ongoing, 15 factors have been identified that are persistent and can be used to help explain much of the variation we see across investments in equities, fixed income and alternative investments. This radar image compares two portfolios, allowing the visualization of risk metrics across each the various factors.

On the left, a cash-weighted chart displays a portfolio’s exposure to various asset classes. What is more telling and important, however, is the volatility attributable to each asset class, displayed on the right. From factor analysis, 96% of this moderate portfolio’s volatility is produced by the equity positions.

Further, factor analysis shows which specific equities are responsible for what portion of that volatility.

Such insight allows adjustments to be made in response. For example, if a particular situation suggests it is appropriate to dial down portfolio risk, then the positions responsible for higher levels of volatility become obvious candidates for change. Or if a new investment is being considered, understanding the risk parameters of current holdings facilitates sourcing the funds without unintentionally overweighting the portfolio toward a given factor.
I am in the process of conducting a factor analysis of each of your portfolios with the goal of making adjustments to better align your portfolio with your risk tolerance and time horizon. I’d like to discuss my findings and how we might make adjustments that will allow us to more easily dial down risk when market indicators suggest such an approach.


