
I hope you are well and enjoying a beautiful fall. The colors here in Asheville are spectacular.
The market was down again this week and has entered a correction. (A correction is defined as being down 10% from recent highs.) You have likely heard a variety of explanations – from the Congressional problems surrounding the Speaker of the House, to the new war in Israel, the continuing war in Ukraine, and to rising interest rates. It is difficult to directly link the market’s moves over the last few weeks to any one of these issues – perhaps a combination of all and more.
While moves lower like this one are unsettling, indicators of stress in the financial system outside of the equity market itself seem well-contained. If such stress indicators begin to suggest that the market’s stress is spreading to other areas of the financial system, then my view would likely change. For the time being, I am watching corporate earnings and listening to how corporations describe their views on their business environment. Halfway through earnings season, the S&P 500 will likely report a year-over-year growth in earnings – the first time since the 3rd quarter of 2022. And as we all know, earnings growth is a good thing for markets.
During times like this, context is important. And to help provide some context, I want to remind you that different market indexes that you see reported in the news or discussed in the media tell us different things.
Here are the closing values (and percent change) of the three major indexes for the U.S. stock market for Friday, October 27th. These indexes include the Dow Jones (DJIA) – an index of 30 very large, industrial companies, the Nasdaq – an index of companies that trade on the Nasdaq market – a market that includes many technology companies, and the S&P 500 – an index of the largest 500 companies (as determined by the company S&P Global – formerly Standard & Poors).
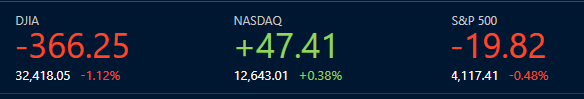
When reflecting on how positive, or negative, a particular day is, the actual point change is less insightful than the percent change. For example, twenty years ago when the level of the Dow was around 8,000, a 366-point drop would have amounted to a decrease of roughly 4.5%. Whereas on Friday with the Dow above 32,000, that 366-point drop amounted to 1.1%. Yes 366 sounds like a big number, but as a percentage, it is not that far from the average point move on any given day.
Further, if you look across the three indexes, you see that while the Dow was down 1.12%, the Nasdaq was up 0.38%, and the S&P 500 was down 0.48%. What is that telling us?
It tells us that the tech-heavy Nasdaq performed better than indexes with less exposure to technology stocks. And even though technology companies have not performed particularly well of late, they did better than other sectors of the market on Friday.
When comparing the Dow with the S&P 500, there is still a pronounced difference in the daily performance on a percentage basis. The reason has to do with the way the indexes are constructed. First the Dow includes only 30 companies, so a fewer number of companies, performing well or poorly on any given day, can have an outsized impact on the Dow. On the other hand, the S&P 500 includes 500 companies, so the index is more diversified than the Dow and less subject to such distortions.
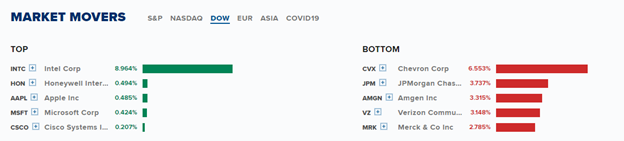
But there is another reason for the difference. The Dow index is constructed using a formula that uses each company’s stock price as part of the formula – the Dow is a price-weighted index. Therefore, UnitedHealth Group at $524 per share and Microsoft at $329 per share have a much larger impact on the movement of the Dow than Intel at $35 per share or Walgreens at $21 per share.
This chart displays the top 5 and bottom 5 performers in the Dow on Friday. Intel was up over 9%, but Chevron, JP Morgan, and Amgen – three companies with much higher share prices than Intel – were down and pushed the entire index lower. Of the three indexes we are discussing, the Dow is the only one that is constructed as a price-weighted index.
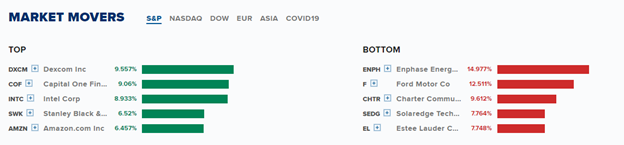
The S&P 500 is a market-weighted index, meaning that larger companies have a greater impact on the index than smaller companies. When this index was originally constructed, the variation of company size across the index was not nearly as great as it is today. Today, the 10 largest companies in the index represent more than 32% of the index. Therefore, the daily performance of Apple, with a market cap of over $2.6 Trillion (that’s a T not a B), and Microsoft, with a market cap of just under $2.5 Trillion, will have a much larger impact on the index than Lincoln Financial with a market cap of $3.7 Billion (that’s a B not a T) or Zion Bancorp with a market cap of $4.5 Billion.
This chart displays the top 5 and bottom 5 performers in the S&P 500 today. You can certainly see some outsized moves in various stock prices, but overall the S&P 500 was lower today by less than 0.5% – a number that is actually a smaller than the long-term average daily change.
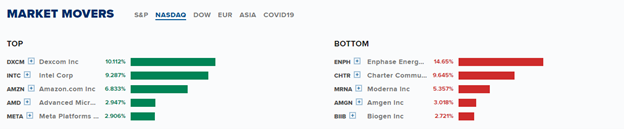
Like the S&P 500, the Nasdaq index is also a market-weighted index but is much broader than either the Dow or the S&P 500 as it includes more than 2,500 companies. The index is heavily weighted toward technology companies (55%) and includes both U.S. and international companies. Because of the weighting toward technology companies, plus exposure to smaller and international companies, the Nasdaq is typically more volatile than the Dow or S&P 500. Again, you can see some outsized changes in individual companies’ stock prices yesterday. However, the overall index was up 0.38%.
September and October are traditionally weak months for the market and this year is no exception. I am hopeful that the pronounced pessimism in the news and in the equity markets will turn. This downturn in the markets and general uneasiness that began in January 2022 has been going on for much longer than normal. I’m ready for a positive change as I’m sure you are too!
If you would like to talk about the market or have questions about anything, please let me know.


