
As the market continues to trudge higher, I continue to hear comments that there must be something wrong with the market. How can the market move higher in the face of the continuing crises this country faces (virus, race relations, upcoming election)? I am always pleased to take the time to respond to such questions, but I worry that sometimes investors make decisions based on such concerns.
The problem some fail to see is that when we talk about the market, we are really talking about an index – the Dow, the S&P 500, or the NASDAQ. Knowing how an index is constructed is crucial to understanding how to interpret its movement and what that index may be telling us about the US economy as a whole.
The most recognized index is the Dow, which comprises 30 companies (Apple, American Express, Boeing, Caterpillar, Cisco and 25 others). An index of just 30 very large companies is rather limited in scope, so equating the Dow’s movement with what’s happening in the broader economy is a bit of a leap. The other thing about the Dow is that its movement (points up & down) is based on the price movements of all components BUT companies with higher stock prices have a larger impact on the Dow’s movement than companies with lower stock prices. For example, the movement of Apple at $390 per share has a much greater impact on the Dow’s overall movement than Cisco at $40 per share. So if you see the Dow up 500 points or down 500 points, much of that movement may be driven by a few high-priced stocks instead of the synchronous movement of all 30.
The S&P 500 provides a better snapshot of the health of the US economy because it is an index of 500 of the largest companies in the country. That’s better than 30, but there are still many more than 500 US companies that are publicly-traded and even more that are privately-held. But there is another issue with the S&P 500 index that can distort our impression of the economy. The movement of the S&P 500 index is based on the size of a company, with larger companies having a larger weighting in the index and smaller companies having a smaller weighting.
The 5 largest companies in the US account for over 22% of the weighting of the S&P 500. Can you guess those 5 companies? Sure, they are Apple, Microsoft, Amazon, Facebook, and Google. Further, the 25 largest companies account for over 40% of the weighting of the S&P 500. See chart below. With so much weighting given to these 25 stocks, the movement of the S&P 500 index says much more about these 25 companies than the economy at large.

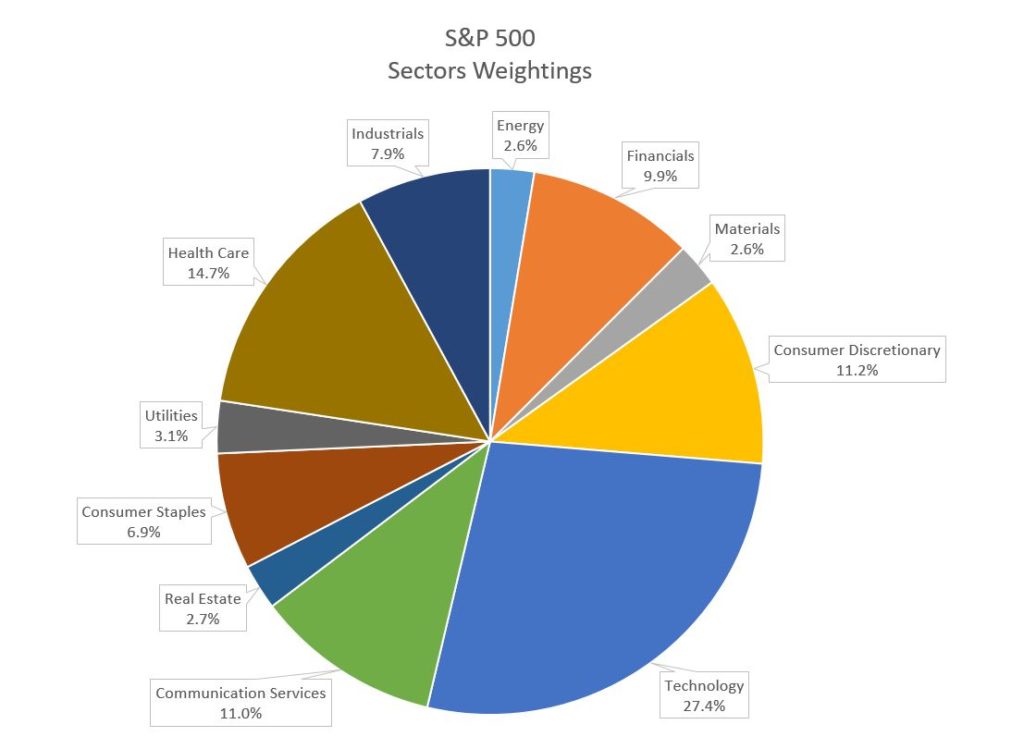
Digging deeper into the S&P index reveals that the sector weightings in the S&P 500 are also skewed in ways that people might miss. Companies are categorized into one of 11 different sectors of the economy, e.g., technology, industrials, materials, energy, financials and so forth. The chart below shows that almost half of the weighting of the S&P 500 is in just 3 sectors – Technology (27.4%), Consumer Discretionary (11.2%), and Communication Services (11.0%).
Click the image above and you will be taken to an interactive chart where you can see the 10 largest companies in each of these sectors. Did you know that Google, Facebook and Netflix are not in the Technology Sector? They are in the Communication Services sector. How about Amazon? Not in the Technology Sector either – instead Consumer Discretionary. What else do you find surprising?
The chart below shows year-to-date sector returns and the overall S&P 500 through last Friday. Consider these returns in the context of the sector classifications of certain companies and how those companies have performed during the pandemic. Do these returns make sense? I would argue yes they do. The sectors of the economy that you would expect to be experiencing difficulty are performing poorly, while those that you would expect to do well are performing well.

Understanding how the S&P 500 index is constructed and the sector classifications of certain companies hopefully helps explain the apparent disconnect between the market and the economy. The S&P 500 index is not a measure of the overall economy, but instead is one data point among many that tells us something about the health of corporate America.
If you have questions or would like to chat, please let me know.
Cheers!


