
I hope you are all well and enjoying a beautiful spring. We continue to see mixed messages with respect to the progress of the pandemic. Things are not completely back to normal but the progress toward such is certainly underway.
Currently, we are in the middle of earnings season with corporate America reporting results for the quarter ending 3/31/2021. Broadly speaking, earnings are coming in strong and stronger than expected. So far, S&P 500 companies are reporting the highest year-over-year growth in earnings since the third quarter of 2010. And many analysts expect double-digit earnings growth for the remaining three quarters of 2021. (Source: FactSet)
While this sounds like great news, it is important to note that these above-average growth rates are due to two things:
- higher earnings for 2021 (higher earnings are good); and
- easier comparisons to weaker earnings in 2020 due to the massive slowdown resulting from the pandemic (the math is a quirk).
I want to highlight this quirk about calculating growth rates in revenue, profits, stock prices, and even things like inflation. Typically, growth rates are calculated on a year-over-year basis. So when interpreting the data, it is important to think back to what was happening a year ago.
For example, the market hit bottom on March 23, 2020, so when I tell you the S&P 500 is up 46% from a year ago, instead of thinking wow – what a great year, you should remember that a year ago was roughly five weeks after that bottom. If I tell you that the price of oil is up 96% from a year ago, instead of thinking wow – inflation is out of control, you should remember that oil prices were crashing a year ago.
Context is always important, so let’s look at annualized growth rates of different assets over the last year versus the past two years.
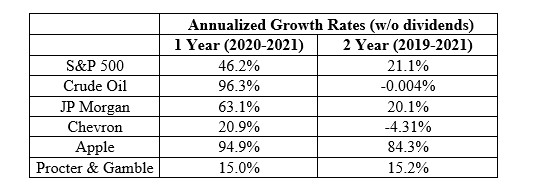
Yes, crude oil is up a lot over the last year, but its price is about the same as it was 2 years ago (annualized growth over the last 2 years is flat). So when people use crude oil/gasoline prices to argue that the US is heading into a period of hyperinflation, the two-year data does not support that argument. Over the past few months, the Federal Reserve has acknowledged inflation pressures within the economy but also suggest these pressures are likely to be transitory. We’ll have to wait and see if that turns out to be the case or if inflation picks up in a more meaningfully way.
As for the four different stocks included in the table, JP Morgan and Chevron show markedly different growth rates across the two different time periods, which seems reasonable given their businesses and the trajectory of the pandemic. Whereas Apple and Proctor & Gamble show much more consistent returns across the two time periods, which also seems reasonable.
What should we expect out of the market for the remainder of the year? Year-to-date, the S&P 500 is already up over 11% on the back of a very strong finish to 2020. I think much of this push higher was in anticipation of what we are seeing from earnings now and will see in coming quarters. Therefore, I do not think it is likely returns will continue at the current pace into the end of the year.
And that quirk of easier comparisons I mentioned earlier, well that quirk will flip the other way as we get into next year. The 2022/2021 year-over-year comparisons will become much more difficult. So do not be surprised if you begin to hear about slowing growth rates along with a drumbeat of gloom and doom news stories. Slowing growth rates do not mean we are in for another bear market, but investors should refine their expectations for market returns going forward.
If you have questions or would like to chat, please let me know.


