
I hope you are well, enjoying the summer, and starting to get out and about. The grip of the pandemic continues to lessen, although the recent trouble with variants reminds us that we are not free and clear of this event. At the same time, the US economy continues to recover in a very robust way and over the last few weeks, the market (S&P 500) has hit 10 new all-time highs.
For some investors, seeing news reports of ever-higher highs often brings thoughts of bubbles and unsettling market corrections from the last 20 years (early 2000s, 2008/2009, late 2018, or February/March 2020). And while we cannot know exactly what the market will do in the coming months or years, we can look to the data that provides a good indicator of long-term market moves – corporate earnings.
Second quarter earnings season got underway this week as the major banks reported earnings that were, for the most part, much better than expected. Next week, we will hear from many more companies, including Coca-Cola, Verizon, Johnson & Johnson and Netflix. Most analysts are expecting strong earnings growth for the second quarter. And while earnings growth (year-over-year change) may slow as we head into the end of the year and next year, that does not mean that we are heading into an earnings recession.
The following chart shows annual, per share earnings for S&P 500 companies over the last 30+ years, along with earnings projections for 2021 through 2024. Spend a moment letting those data sink in. The projected growth for 2022 vs. 2021 or for 2023 vs. 2022 is not nearly as high as the projected growth for 2021 vs. 2020, but earnings are nevertheless projected to grow.
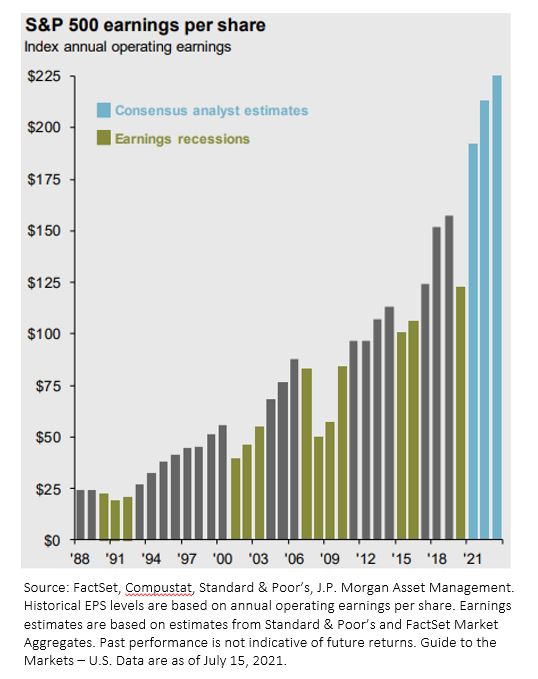
The S&P 500 index is up almost 16% YTD, likely a function of the market looking ahead at earnings. The market may not keep up this pace as earnings growth slows into next year, however these data do support the argument that recent market highs are not the result of a bubble. Instead, recent market activity is more about earnings growth. That is a good thing!


